I mostly use the vSphere Flash client and was monitoring my vSAN performance with it. I noticed TCP inbound loss rate was ranging from 1-10% on the vSAN host TCP packet retransmission and loss rate graph. My VMs did not seem to be impacted. Also, there is bound to be some loss with TCP. However, this number seemed high to me.
I had a case open with VMware GSS and they could not figure out what was the underlining issue. They blamed my Cisco UCS servers. Cisco didn’t have any ideas. Nothing seemed wrong with my physical switches.
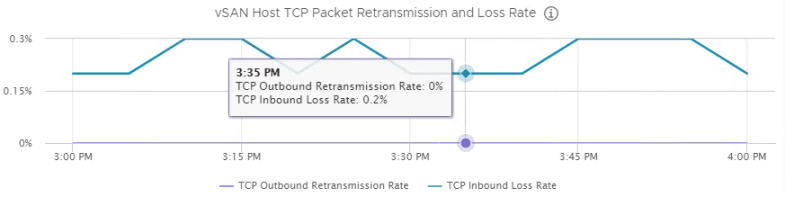
Then one day I used the HTML5 client and looked at the same graph. The numbers were much lower. I went back to the Flash client and the numbers were high. I followed the graphs over multiple time periods, on every host, and noticed the numbers were always off by a factor of ten. See the two screenshots below. You can see the flow of the line graph is the same, but with the y axis on a different scale. Also, every exact time I hover over is always off by a factor of ten.
I have a cluster on VMware Cloud on AWS. That of course is using vSAN so I decided to check it out. Same exact problem! Therefore, it has nothing to do with my on-prem configuration or version. I reported the issue to VMware and didn’t seem like they will do anything about it. After all, the Flash client will be deprecated in the next major release of vSphere. Though, still frustrating that I chased what I thought was a problem for a while and it turned out to be a bug with the graph. I hope no one else falls for this too.
Flash Client (Flex)
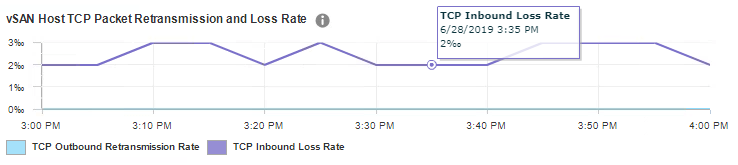
HTML5 Client