
I mostly use the vSphere Flash client and was monitoring my vSAN performance with it. I noticed TCP inbound loss rate was ranging from 1-10% on the vSAN host TCP packet retransmission and loss rate graph. My VMs did not seem to be impacted. Also, there is bound to be some loss with TCP. However, this number seemed high to me.
I had a case open with VMware GSS and they could not figure out what was the underlining issue. They blamed my Cisco UCS servers. Cisco didn’t have any ideas. Nothing seemed wrong with my physical switches.
Then one day I used the HTML5 client and looked at the same graph. The numbers were much lower. I went back to the Flash client and the numbers were high. I followed the graphs over multiple time periods, on every host, and noticed the numbers were always off by a factor of ten. See the two screenshots below. You can see the flow of the line graph is the same, but with the y axis on a different scale. Also, every exact time I hover over is always off by a factor of ten.
I have a cluster on VMware Cloud on AWS. That of course is using vSAN so I decided to check it out. Same exact problem! Therefore, it has nothing to do with my on-prem configuration or version. I reported the issue to VMware and didn’t seem like they will do anything about it. After all, the Flash client will be deprecated in the next major release of vSphere. Though, still frustrating that I chased what I thought was a problem for a while and it turned out to be a bug with the graph. I hope no one else falls for this too.
Flash Client (Flex)
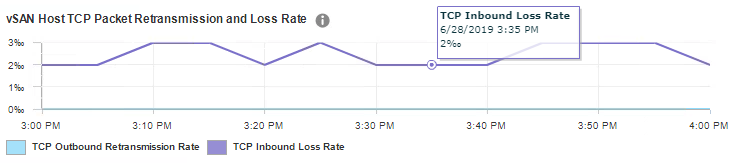
HTML5 Client


Hello Brian,
Thank you for this page.
IMHO your two graphs show the same values. Flex shows “2 per thousand” which is the same as the 0.2% in html5. I came to your blog because I have a 5% TCP inbound error rate in my vSAN cluster. I’m curious to know if you’ve got some valuable information from VMware GSS during trouble-shooting.
LikeLiked by 1 person
Hi Francois
Thank you very much for your comment. At first, I thought what are you talking about. Flex says 2% and HTML says 0.2%. I stared at your comment and thought it over. Then I showed it to my girlfriend and she agreed with me. Afterwards we zoomed in on the Flex image and noticed the percent symbol with an extra circle. She’s smarter than me and told me that’s actually a per mille, which is 1/10 of a percentage. I was shocked. I never heard of a per mille until tonight. My lack of understanding of the symbol made me think the numbers were different. However, they are the same for both clients! I appreciate you pointing this out to me and I am glad I learned something new. I will have to post a correction to my article. There is indeed no inaccuracy in these charts between the two clients.
Thank again
Brian
LikeLike
Hello again Francois
I wanted to make a separate command in hopes I can help you. VMware support also does not know what a per mille is because they thought I had a high loss rate because they troubleshooted the issue with me for a few weeks. Anyway, here are some suggestions you can try that I received from VMware.
Check the power settings of your servers. Make sure you set them to use no power savings settings. Set to high power usage in the BIOS and the host setting.
Increase the RX buffer ring size on the vSAN NICs. This one is a little tricky for a couple of reasons. First, the place to change it depends on the server vendor you use. Second is increasing it too much can increase latency. If you have Cisco UCS servers, like me, then you need to change the adapter policy in UCSM. Of course, be careful and see what else is using this policy. Then an acknowledge in UCSM and rebooting the server is required for the change to take effect, according to Cisco. I went from 512 to 1024. Let me know if you also have Cisco servers and I will tell you where to make the change. Some vendors will allow you to make the change via a command when SSHing into the host.
I did notice the loss rate when down when there was more IO across the cluster. I am not sure why. This was a new cluster and the loss rate was higher at first. However, the loss rate went down a little once there was more VMs running and higher IO.
Lastly, see if it’s worth it for you to look at the physical switch side. Switch logs were sent to Cisco for review. There was no issue on that side for me.
I hope this helps.
Brian
LikeLike